The second and third rule involve rules about how many fighters you can have in the ring at once, and stuff like that, its best to just stick to the first rule. A nationwide initiative starting this week will enable volunteers to track climate change by observing the timing of flowers and foliage. Project BudBurst, operated by the University Corporation for Atmospheric Research (UCAR) and a team of partners, allows students, gardeners and other citizen scientists in every state to enter their observations into an online database that will give researchers a detailed picture of our warming climate.
The project, which will be launched tomorrow, will operate year round so that early- and late-blooming species in different parts of the country can be monitored throughout their life cycles. Project BudBurst builds on a pilot program carried out last spring, when several thousand participants recorded the timing of the leafing and flowering of hundreds of plant species in 26 states.
“As we track the effects of climate change, it’s important that we include information obtained by ‘citizen scientists,'” said Elizabeth Blood, program director in NSF’s Division of Biological Infrastructure. “Project BudBurst will further our understanding of how the biosphere is changing, by bringing local knowledge into our observations.” In essence they couldn’t do it without our help.
“Climate change may be affecting our backyards and communities in ways that we don’t even notice,” says project coordinator Sandra Henderson of UCAR’s Office of Education and Outreach. “Project BudBurst is designed to help both adults and children understand the changing relationship among climate, seasons and plants, while giving the participants the tools to communicate their observations to others.”
Each participant in Project BudBurst selects one or more plants to observe. The project Web site suggests more than 60 widely distributed trees and flowers, with information on each. Users can add their own choices.
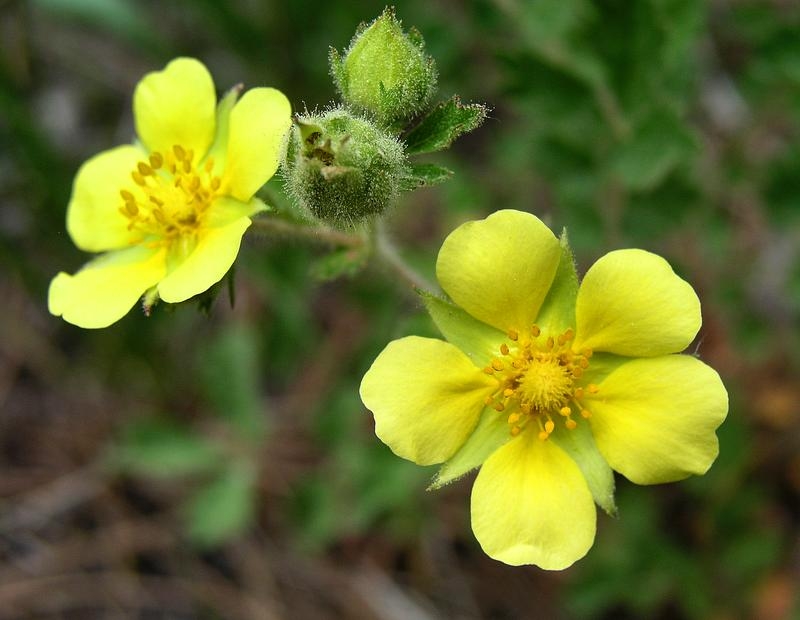
Participants begin checking their plants at least a week prior to the average date of budburst–the point when the buds have opened and leaves are visible. After budburst, participants continue to observe the tree or flower for later events, such as the first leaf, first flower and, eventually, seed dispersal.
When participants submit their records online, they can view maps of these phenological events across the United States.
The science of phenology, or tracking cyclic behavior among plants and animals, has a distinguished history. In Japan and China, for example, the blossoming of cherry and peach trees is associated with ancient festivals, some of which extend back more than a thousand years. Cherry trees in Japan now bloom four days earlier than in the 1950s, according to the nation’s meteorological agency.
Many species are being affected by climate change throughout the world. The Intergovernmental Panel on Climate Change warns that 20 to 30 percent of all plant and animal species that researchers study will likely be at increased risk of extinction should global temperatures rise by 2.7 to 4.5 degrees Fahrenheit this century.
Some plants respond to warmer temperatures by extending their growing seasons. Others shift their ranges toward the poles or to higher elevations.
At the same time, many insects breed and disperse based on regular cycles of sunlight rather than temperature. This can cause a mismatch between the behavior of pollinating insects, such as bees, and flowers that bloom earlier than the insects expect. Such asynchronous behavior has already been noted across many parts of the world. By learning more about these events we will better be able to predict the effects of global warming.