Charts and graphs are some of the most efficient ways of displaying a lot of data in a very easy to understand way. Charts and graphs like statistics can be manipulated to push a certain message, and I can not guarantee that all of these graphs adhere to the highest in ethical standards, but taken together they paint an interesting picture of modern life. (click images for full size)
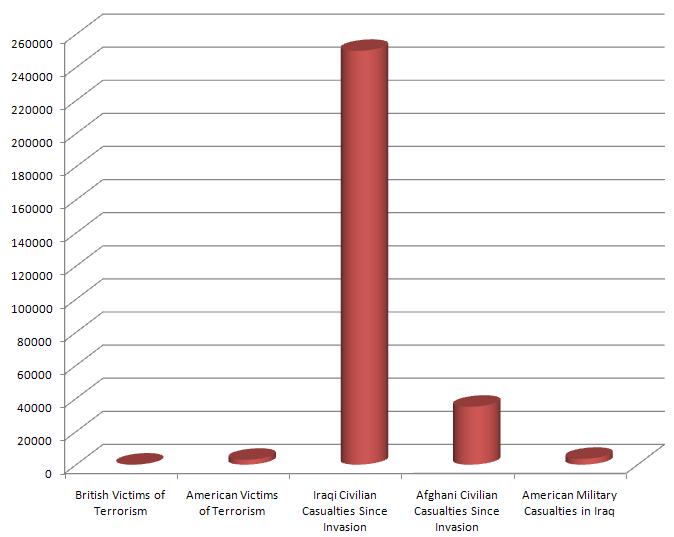
Deaths from various causes(via)
Bush poll numbers over time (image credit wall street journal)
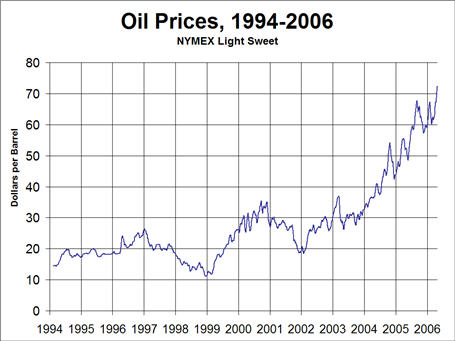
Price of oil over time (via)
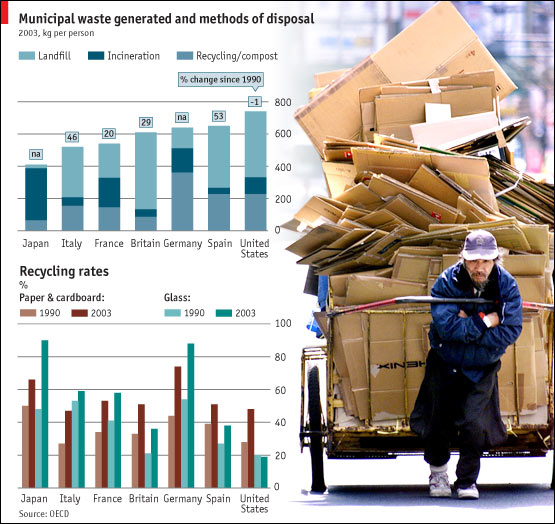
Recycling rates over time (via)
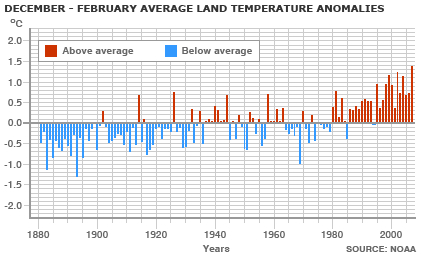
Average temperatures over time (via)
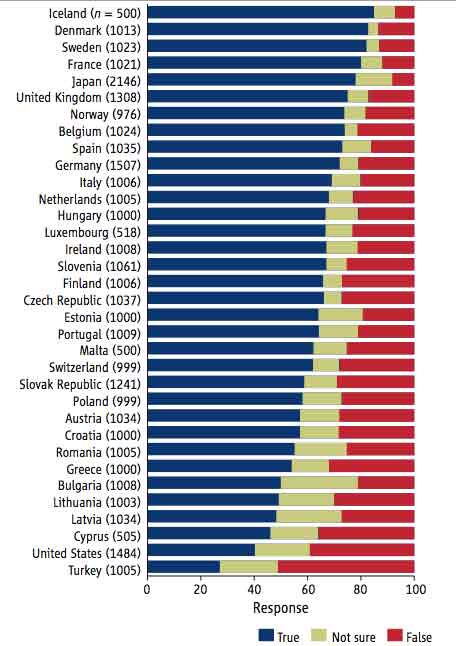
People who accept the theory of evolution various countries (via)
Number of Atheists various countries (via)